Building Better Forecasts with Excel's Forecast Sheet Feature
Added to the 2016 release of Excel were several new functions – such as FORECAST.ETS – that will assist those building budgets and forecasts, particularly when working with historical data that reflects seasonality. In addition to these new functions, Microsoft also added a very powerful new feature – ForecastSheet – that remains largely a mystery to many Excel 2016 users. In this tip, you will learn how you can put Forecast Sheets to use to create more accurate forecasts based on historical data.
Creating a Forecast Sheet
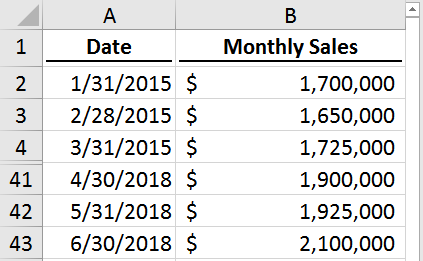
To create a Forecast Sheet in Excel 2016, you must first ensure that you have arranged your data properly. More specifically, you will need two columns of data – one column containing dates and a second column containing historical data that corresponds to the dates (sales data, for example). These two columns of data should resemble that pictured in Figure 1 (with some rows hidden for presentation purposes.)
Figure 1 - Data Arranged Properly to Create a Forecast Sheet
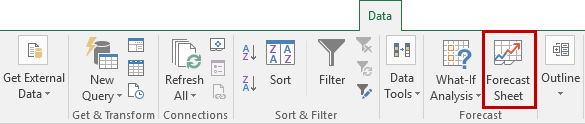
Once you have arranged your data properly, simply click on any of the data points in the data and choose Forecast Sheet from the Data tab of the Ribbon, as shown in Figure 2.
Figure 2 - Selecting Forecast Sheet from the Data Tab of the Ribbon
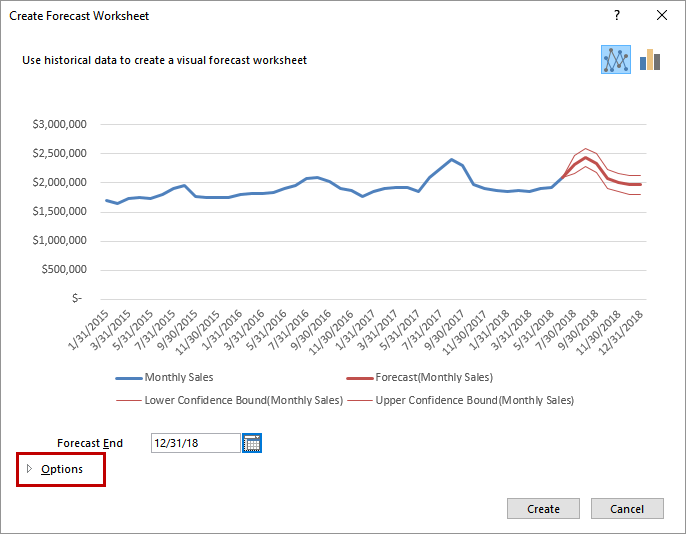
As shown in Figure 3, Excel then presents a preview of your forecast. Importantly, notice that the forecasted data appears in red on the line chart, and that Excel also generates upper and lower confidence intervals as a part of creating the forecasted data.
Figure 3 - Preview of Forecast Generated Using Forecast Sheet
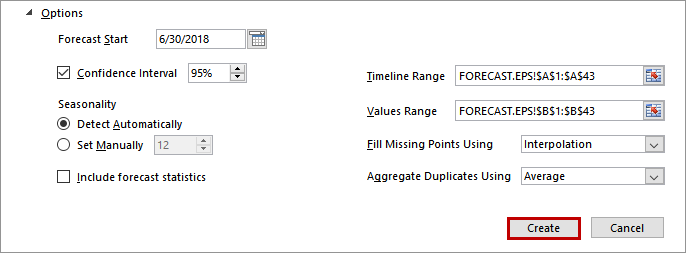
Clicking Options allows you to access and edit numerous options related to your project, as indicated in Figure 4. Among the more significant options is the ability to edit the confidence interval, if you desire an interval different than the default of 95%.
Figure 4 - Options Available for Editing in a Forecast Sheet
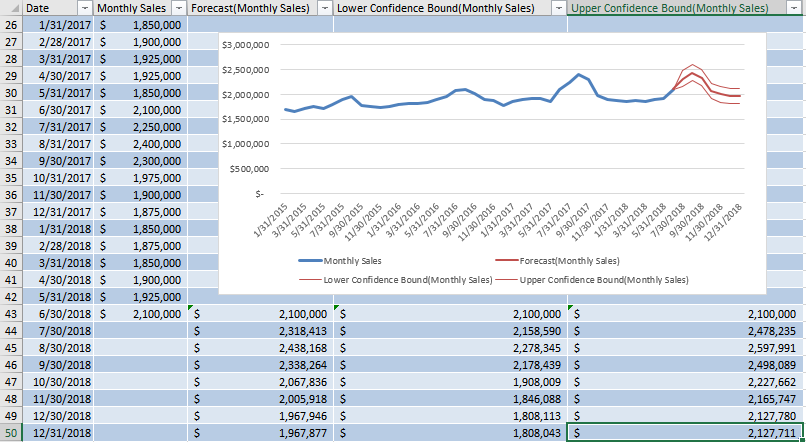
Once you finish editing any Options, click Create to complete the process of creating your Forecast Sheet. Upon doing so, Excel builds the Forecast Sheet, including forecasted values and forecasted upper and lower confidence intervals, as shown in Figure 5.
Figure 5 - COMPLETED FORECAST SHEET
Summary
The Forecast Sheet tool was added to Excel 2016 and provides a superior option for quickly and easily creating forecasts based on historical data grouped by time period. Among the benefits of using this feature is the tool’s ability to recognize seasonality in your data and account for that seasonality when creating a forecast, something that traditional linear projections do not do. Additionally, the speed with which you can create a forecast using this tool is unparalleled, providing an easy-to-use and quick approach to what could otherwise become a tedious and time-consuming task. If you are running Excel 2016 or newer, look in to using this tool to assist you when trying to build budgets and forecasts; if you are not yet running Excel 2016 or newer, be sure to look for Forecast Sheet when you do upgrade.
ARE YOU RECEIVING THE K2 TECH UPDATE NEWSLETTER BY EMAIL EVERY MONTH?
We use cookies to ensure that we give you the best experience on our website. Continuing to use this website acknowledges your consent to our privacy policy.Understood.Privacy policy