Power Pivot is causing many business professionals to re-think how they create reports and analyses. However, for those that need to summarize data based on fiscal periods – instead of calendar periods – reporting in Power Pivot can be a bit cumbersome and challenging. Fortunately, there is a very easy-to-use solution – date tables – and in this tip, you will learn how you can add date tables to speed the process of reporting based on fiscal periods in Power Pivot.
What is a Date Table and How Do I Create One?
In the simplest of terms, a date table is nothing more than a “mapping” table that contains all dates for a given period “mapped” into fiscal periods. To illustrate, consider the example of the date table pictured in Figure 1; it is used to map the date value in column A into the appropriate fiscal quarter and fiscal year in Column B and Column C respectively, based on a fiscal reporting cycle that begins on July 1 and ends on June 30.
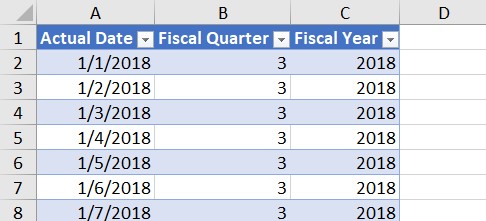
You can create the data for your date table using one of several approaches, including manually typing the data into the worksheet. However, in the example pictured above, the entries in the Fiscal Quarter and Fiscal Year columns were created using the following formulas.
Fiscal Quarter: =IFS(MONTH(A2)<4,3,MONTH(A2)<7,4,MONTH(A2)<10,1,
MONTH(A2)<13,2)
Fiscal Year: =IF(MONTH(A2)<6,YEAR(A2),YEAR(A2)+1)
When creating this mapping data, be sure to convert it to a table in Excel, using a CTRL + T keyboard shortcut or by selecting Format as a Table from the Home tab of the Ribbon, or by using any of the other table creation options available in Excel.
Adding the Date Table to Power Pivot
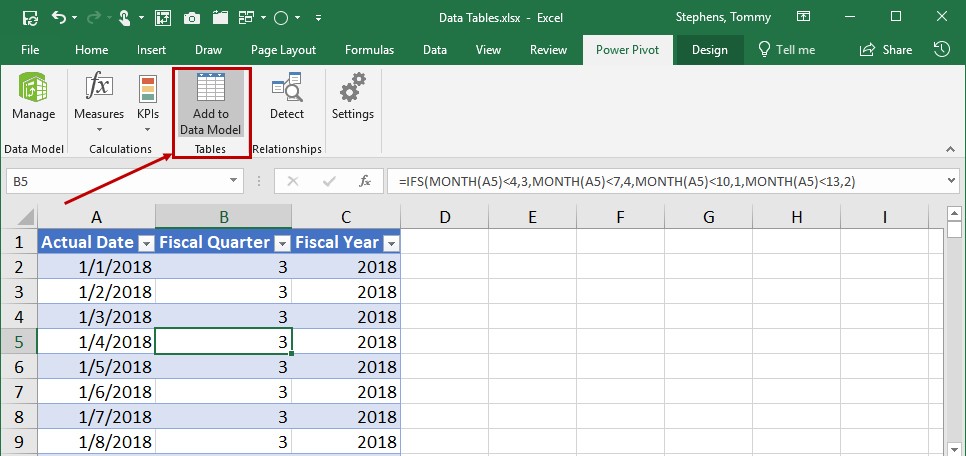
After you have created the data for your date table, you will need to upload it to Power Pivot. One of the simplest ways to do this is to click anywhere inside the table and then click Add to Data Model from the Power Pivot tab of the Ribbon, as shown in Figure 2.
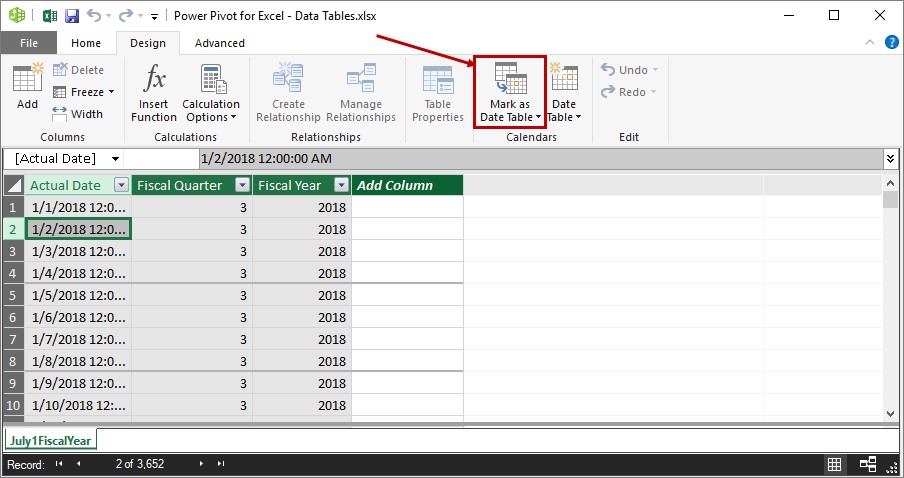
Once the table has been added to the data model in Power Pivot, from Power Pivot’s Design tab of the Ribbon, select Mark as Date Table, as shown in Figure 3.
Using Your Date Table for Fiscal Period Groupings
With your date table added to the data model (and other tables also in the data model), you can take advantage of the power of date tables. In the example pictured in Figure 4, the date table entitled July1FiscalYear is related to the Transactions table; likewise, the Transactions table is related to the ProductName table.
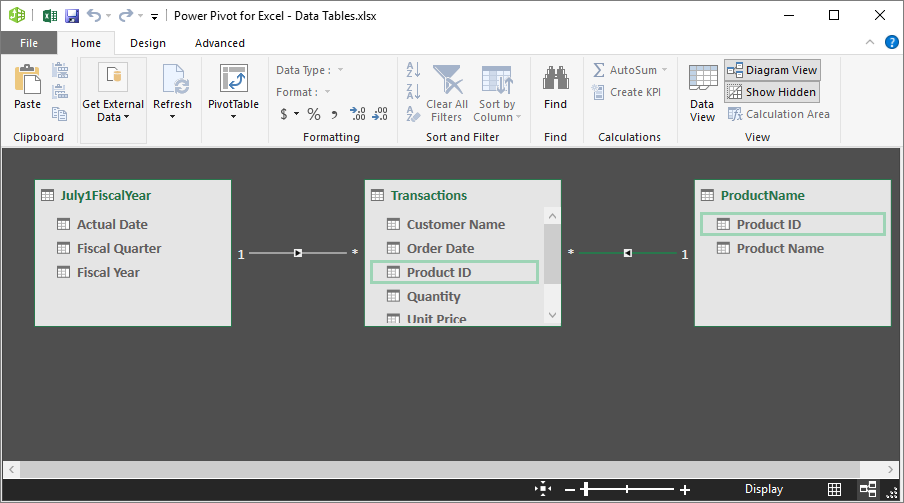
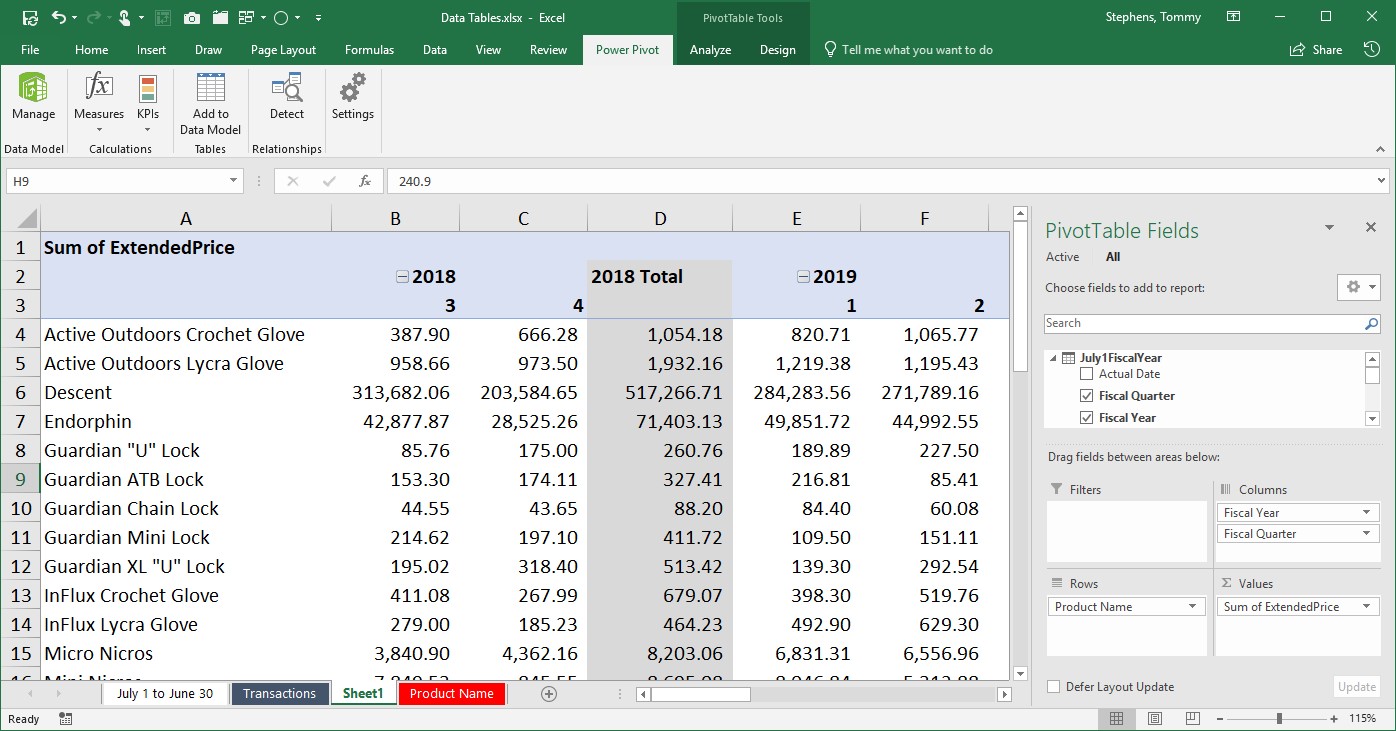
The presence of these relationships means that we can create a PivotTable that uses the Fiscal Quarter and Fiscal Year fields from the date table to summarize the data from the other tables in the data model into fiscal periods, instead of calendar periods. Figure 5 provides a sample of such a PivotTable, with numerous rows and columns hidden for presentation purposes.
Summary
Power Pivot is a fantastic resource for summarizing and analyzing transactional data, including potentially very large quantities of transactional data. But if you need to build your reports on anything other than calendar reporting periods, Power Pivot can be a bit challenging to work with. Fortunately, date tables make it quite easy to use Power Pivot to summarize and analyze data on fiscal reporting periods. Further, the steps to use a date table are quite simple: 1) create a table that maps the actual date to the appropriate fiscal periods; 2) upload that table into your data model; 3) mark the uploaded table as a date table; and 4) relate the date table to the other tables in your data model. Complete these four steps and in no time at all you will be taking full advantage of all that date tables have to offer!